What is Tableau Public?
Tableau Public is a free service that lets anyone publish interactive data visualizations to the web.
Who is Tableau Public for?
Tableau Public is for anyone interested in understanding data and sharing those findings as data visualizations with the world. Journalists, writers, bloggers, students, professors, hobbyists, critics, citizens and more. As soon as a workbook is published to Tableau Public, the viz is accessible by anyone on the internet (with some restrictions – see below), so be sure to only use data that is suitable for a public audience.
Source: https://community.tableau.com/docs/DOC-9135
Pros
- Excellent way to share data with library management, decision makers, and the Board of Trustees
- Gives the data more meaning
- Easier to spot trends
Cons
- Exporting data from multiple sources is still time consuming
- Normalizing the data also takes time
- Learning curve
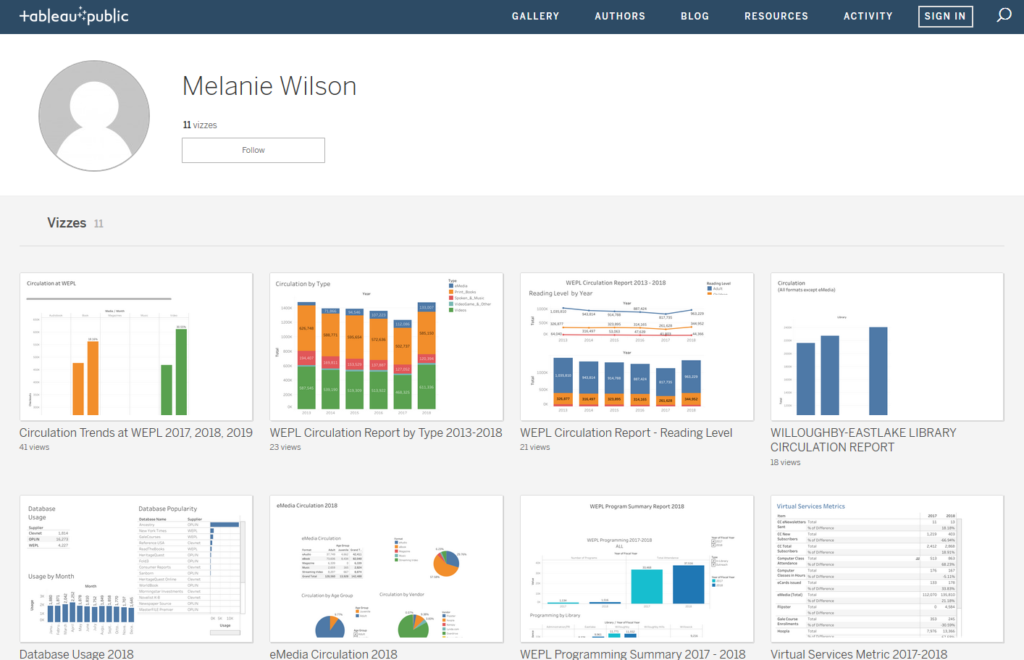
Vizzes are published on a public profile available on the Tableau Public website:
https://public.tableau.com/profile/melanie.wilson3405#!/
Before using Tableau Public, you’ll want to export and normalize the data you are interested in analyzing. Below are some tips:
- What data are you going to want to analyze?
- Are you interested in seeing differences or trends based on branch, month, year, item type?
- Will you want to filter by physical vs. digital?
- Make these considerations before exporting your data as it may influence the data you export.
- Make these considerations before exporting your data as it may influence the data you export.
Normalize the data and column headers
Format/ Item Type
- For example: eBooks & eBook Tip: Use Find and Replace so that the same term is used across of all your sheets
Column headers
- For example: # of transactions & checkouts. Use the same terminology for all column headers across your sheets
Think about what columns you’d manually like to add to your dataset
-
- Platform
- Collection Type
- Media (Larger categories for grouping items)
- Audiobook
- Book
- Magazines
- Music
- Video
A brief overview of how to use Tableau Public to create visualizations based on circulation data from multiple sources
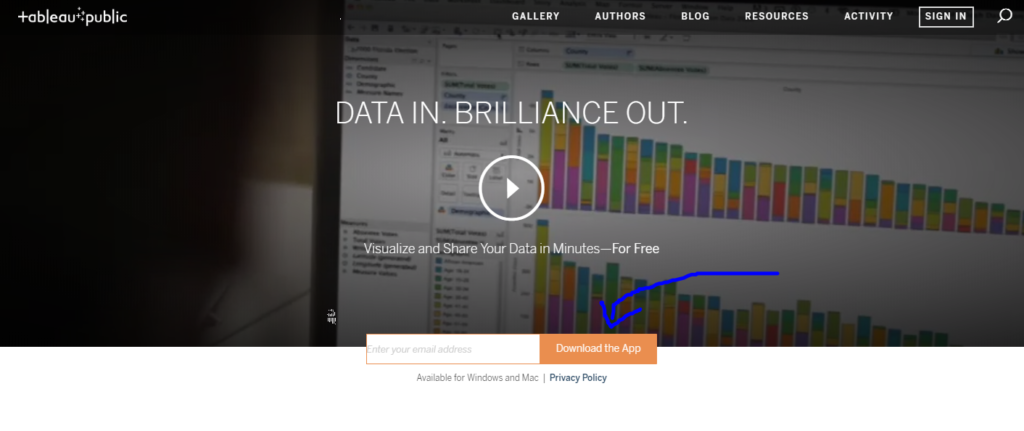
1) Go to https://public.tableau.com. Type your email address to download the app.
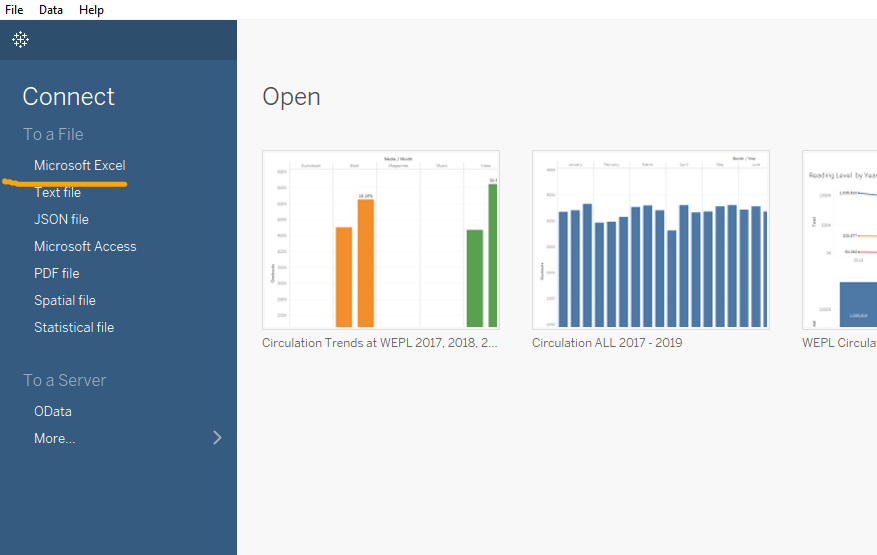
2) Open Tableau Public. Click Connect -> Microsoft Excel. Navigate to where the Excel worksheet is saved on your computer.
3) On the Data Source tab, drag New Union to the white area. Then drag all of the Sheets into the Union specific box. Click OK.
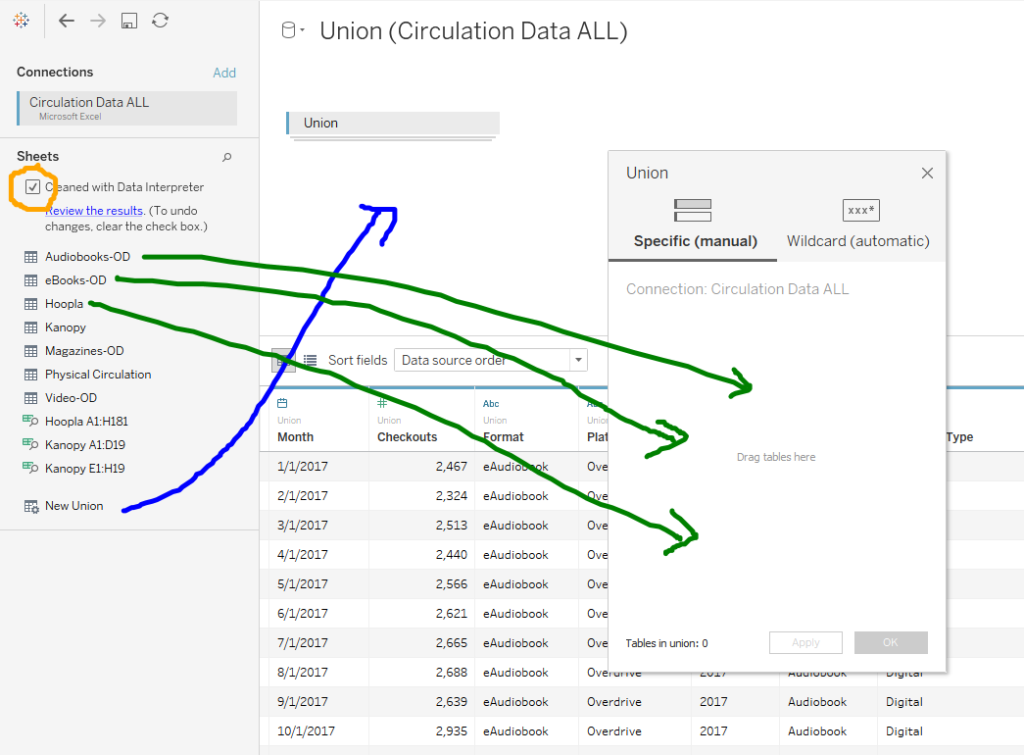
4) Make sure your data types are correct. Month = date. Checkouts = number.

4) On Sheet 1, build your visualization by dragging and dropping the Dimensions & Measures to the Columns & Rows.
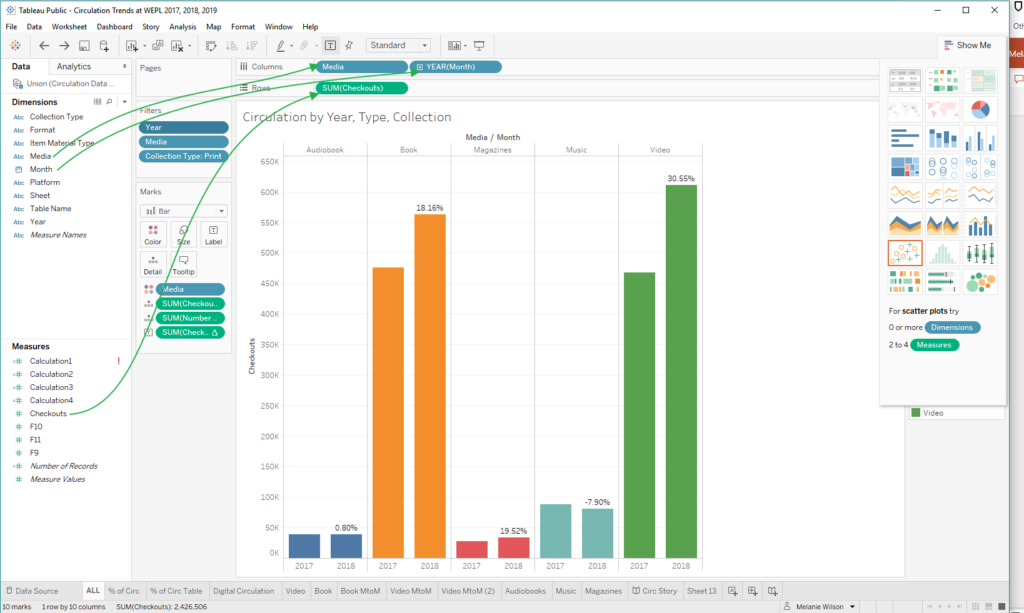
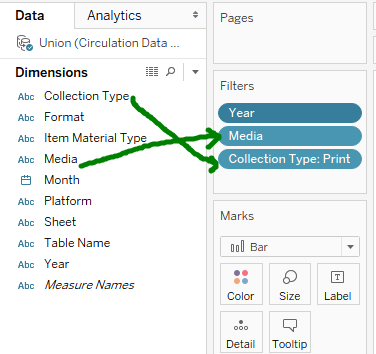
5) Filters will help users interact with your data. To add a filter, move the Dimension you’d like to filter to the Filters card. In order to display the filter in your Viz, right-click on the Dimension in the Filter box and select “Show Filter”.

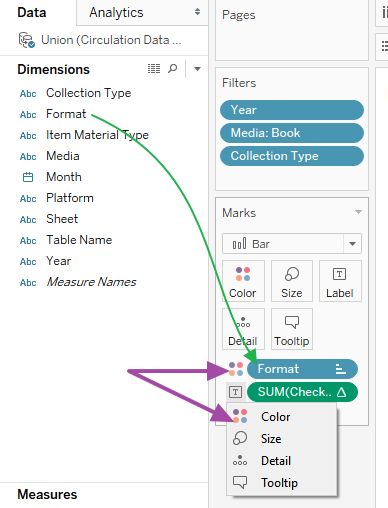
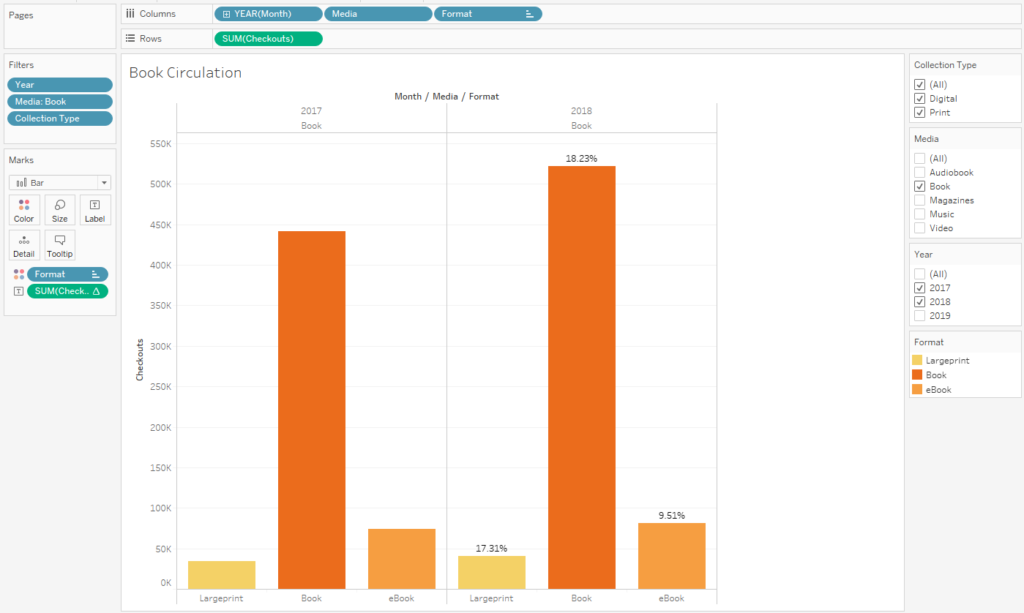
6) Changing the color of Dimensions will help users differentiate the data. The Marks card will allow you to customize how data is displayed. In the example below, to change the color of the Format in the side by side bar chart, drag and drop the Format dimension to the Marks card. Left-click the Marks property icon next to Format and select the Color property.
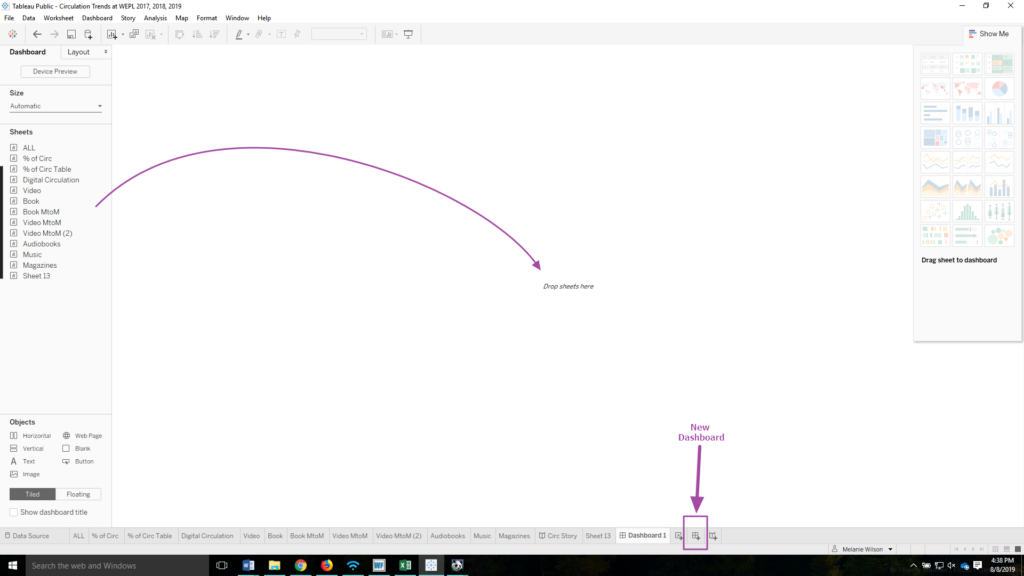
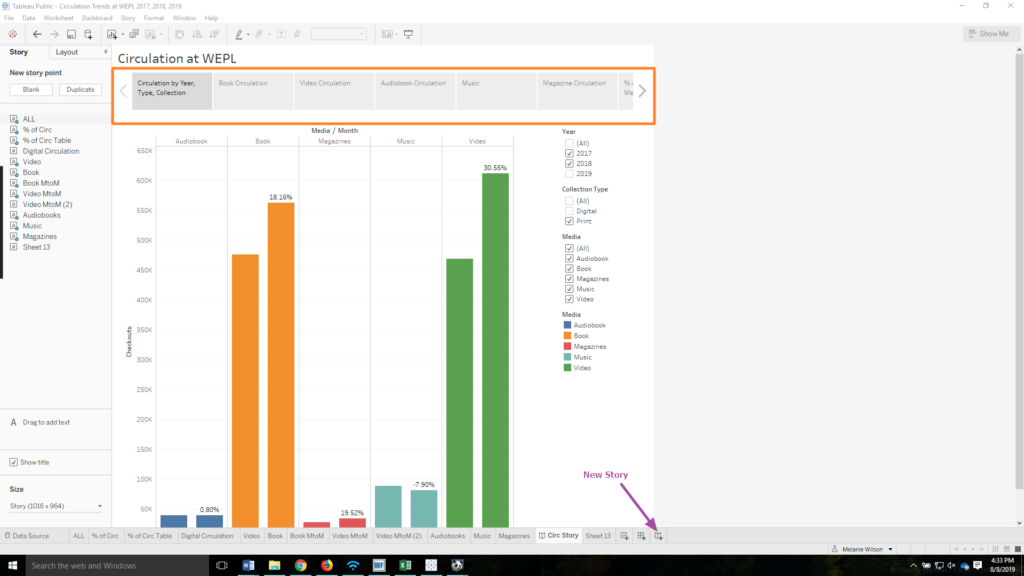
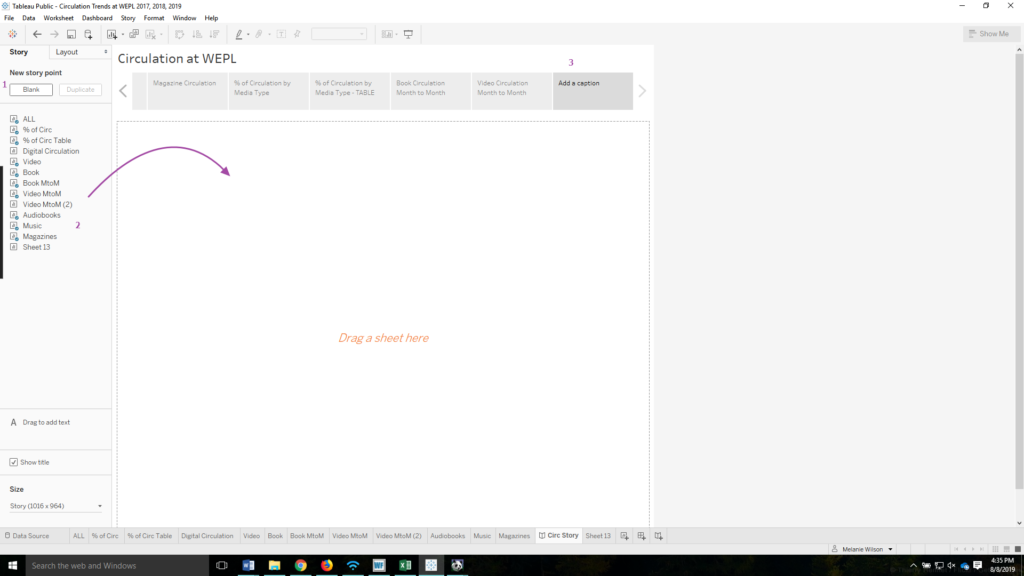
7) Dashboards and stories allow you to bring your data together in a more meaningful, easier to share display. Dashboards allow you to combine data from multiple sheets into a single visualization. Stories allow you to combine data from multiple sheets into a storybook format that users can easily click through.
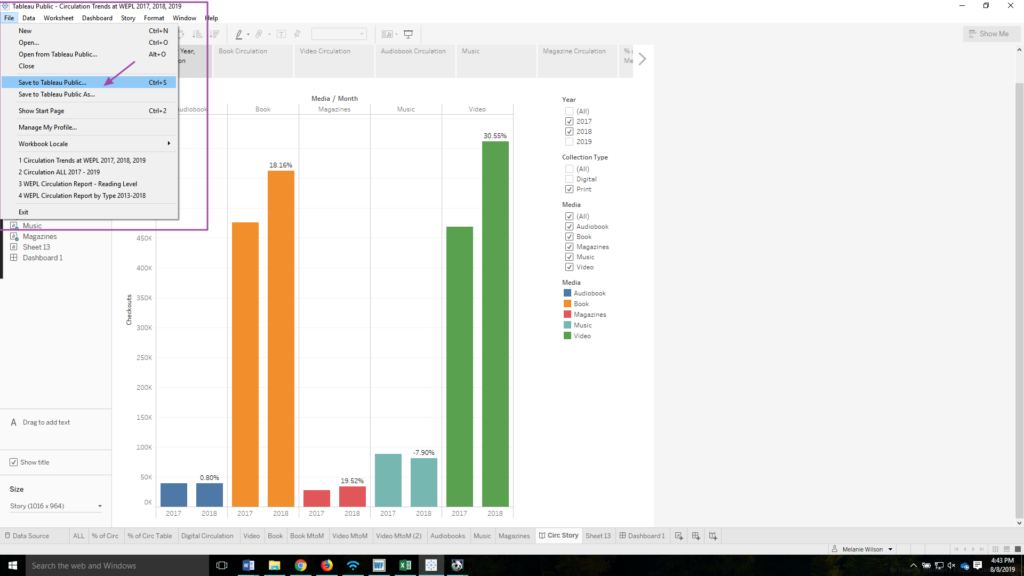
8) When you are comfortable with the Viz that you have created, navigate to File in the menu and click Save to Tableau Public… . If you would like to share the story or dashboard view, make sure that is open on your screen before you click Save. If you aren’t already signed in, you will be prompted to log in to your Tableau Public account. As soon as you hit save, your Viz will be published in your Tableau profile for the world to see. You can make further changes to your document. Every time you click save the changes are reflected on the Tableau Public website.
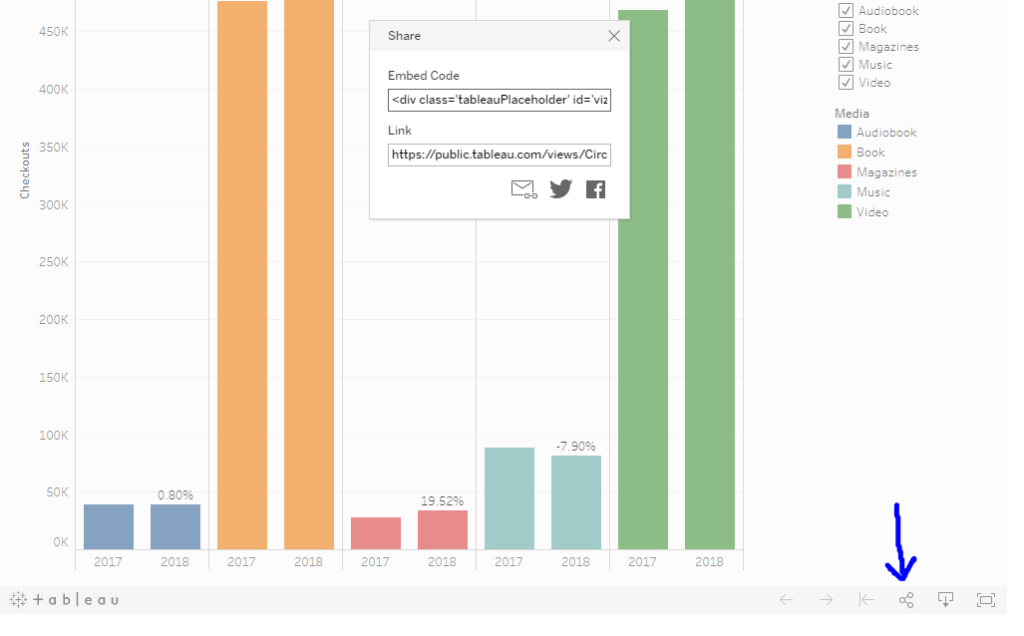
9) Once your Viz is published to the Tableau Public website, it is easy to share the Viz via Link available by clicking on the Share icon.
