News

Technology & Libraries, Tools of the Trade

Visualizing Library Circulation Trends Using Tableau Public

What is Tableau Public?   ​

Tableau Public is a free service that lets anyone publish interactive data visualizations to the web.

Who is Tableau Public for? ​

Tableau Public is for anyone interested in understanding data and sharing those findings as data visualizations with the world. Journalists, writers, bloggers, students, professors, hobbyists, critics, citizens and more.  As soon as a workbook is published to Tableau Public, the viz is accessible by anyone on the internet (with some restrictions – see below), so be sure to only use data that is suitable for a public audience.​

Sourcehttps://community.tableau.com/docs/DOC-9135

Pros
  • Excellent way to share data with library management, decision makers, and the Board of Trustees
  • Gives the data more meaning
  • Easier to spot trends
Cons
  • Exporting data from multiple sources is still time consuming
  • Normalizing the data also takes time
  • Learning curve

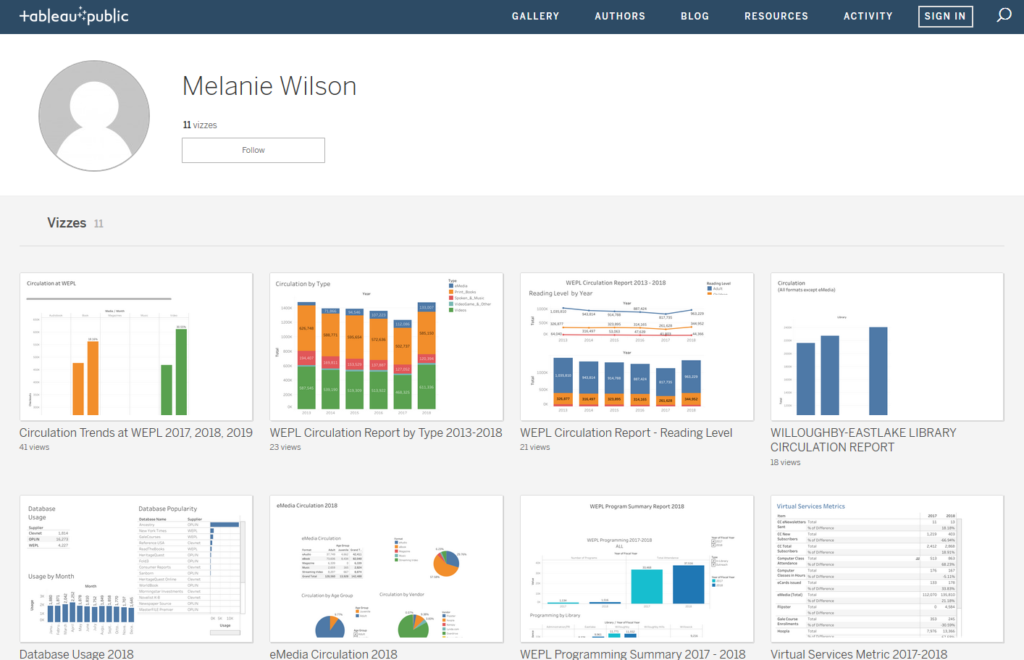
Vizzes are published on a public profile available on the Tableau Public website:

Vizzes in Tableau Public

https://public.tableau.com/profile/melanie.wilson3405#!/​

Before using Tableau Public, you’ll want to export and normalize the data you are interested in analyzing. Below are some tips:

  • What data are you going to want to analyze?  
    • Are you interested in seeing differences or trends based on branch, month, year, item type?
  • Will you want to filter by physical vs. digital?
    • Make these considerations before exporting your data as it may influence the data you export. 

Normalize the data and column headers

Format/ Item Type 

  • For example: eBooks & eBook  Tip: Use Find and Replace so that the same term is used across of all your sheets

Column headers

  • For example: # of transactions & checkouts. Use the same terminology for all column headers across your sheets

Think about what columns you’d manually like to add to your dataset

    • Platform
    • Collection Type
    • Media (Larger categories for grouping items)
      • Audiobook
      • Book
      • Magazines
      • Music
      • Video

A brief overview of how to use Tableau Public to create visualizations based on circulation data from multiple sources

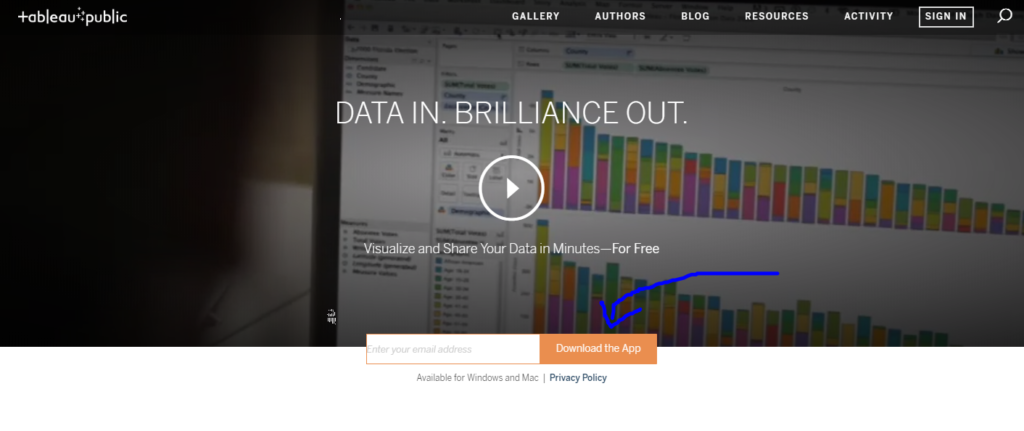
1) Go to  https://public.tableau.com.  Type your email address to download the app.

Tableau Public website with download link

2)      Open Tableau Public.  Click Connect -> Microsoft Excel. Navigate to where the Excel worksheet is saved on your computer.
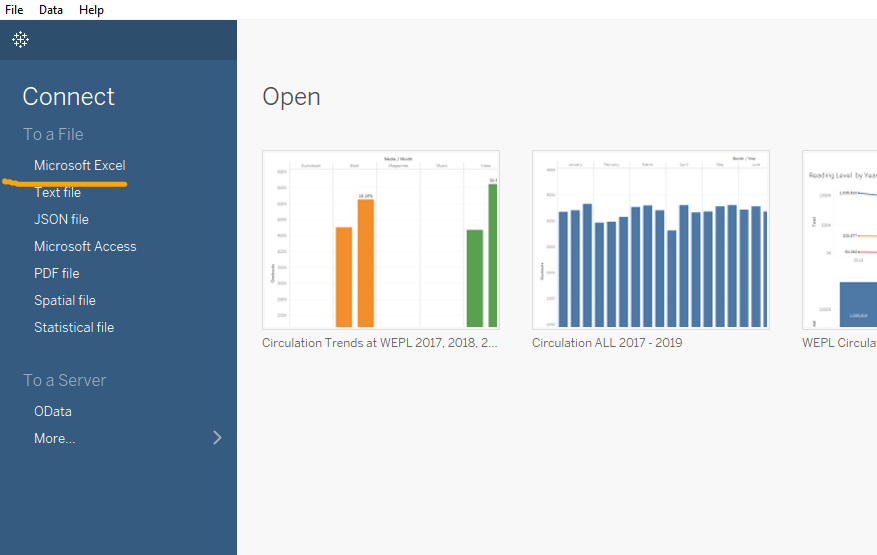
Connect data in Tableau

3)      On the Data Source tab, drag New Union to the white area.  Then drag all of the Sheets into the Union specific box. Click OK.
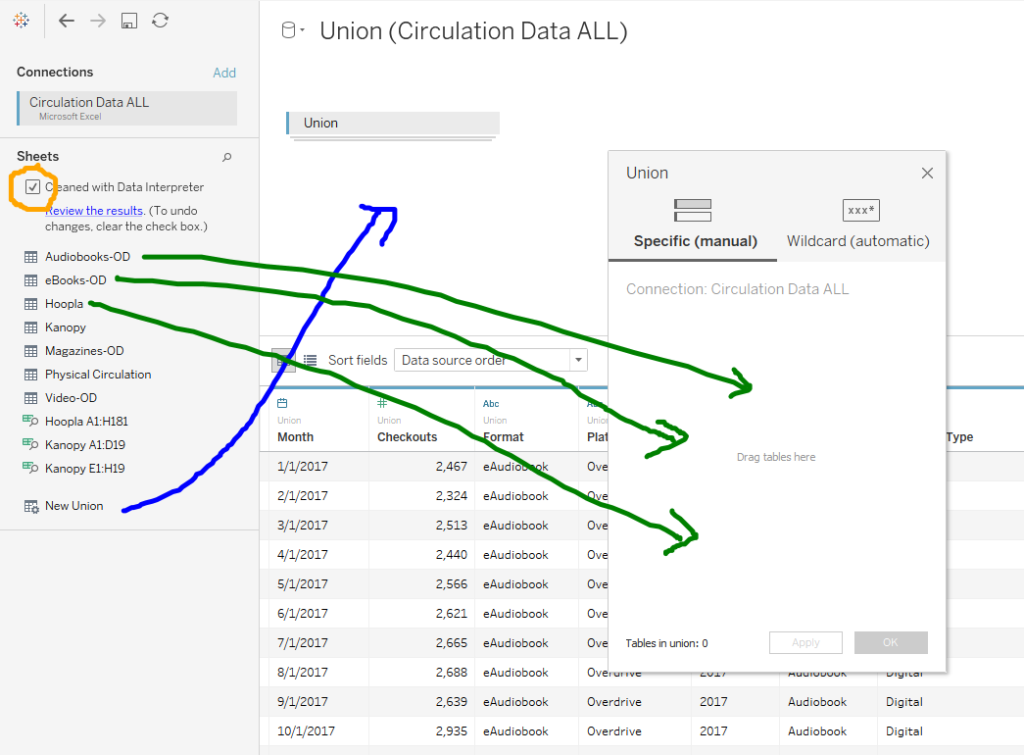
4)      Make sure your data types are correct.  Month = date.  Checkouts = number.

Data Types

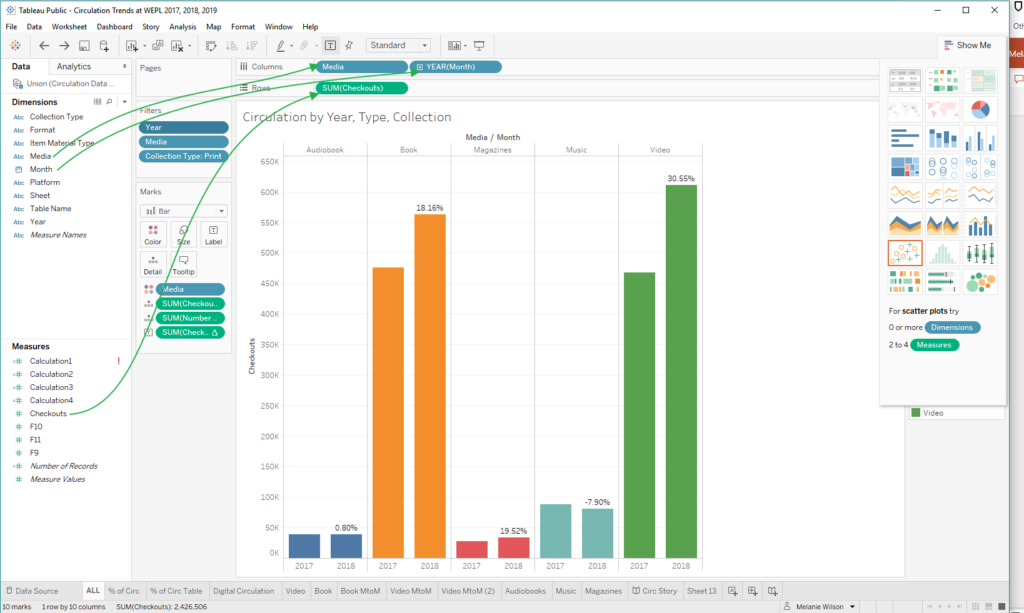
4)  On Sheet 1, build your visualization by dragging and dropping the Dimensions & Measures to the Columns & Rows.
5) Filters will help users interact with your data.  To add a filter, move the Dimension you’d like to filter to the Filters card.  In order to display the filter in your Viz, right-click on the Dimension in the Filter box and select “Show Filter”.
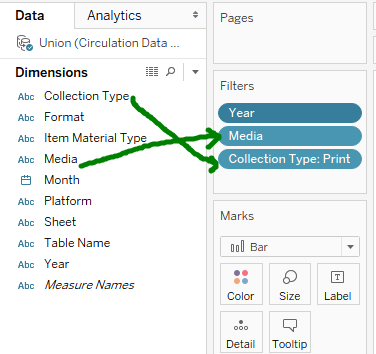
Adding Filters

Showing Filters

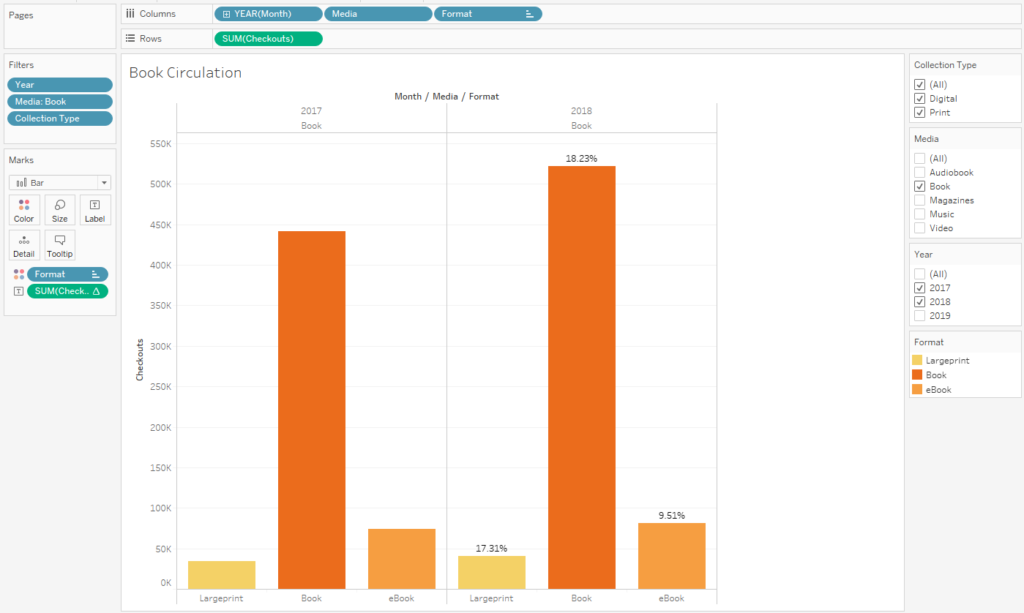
6) Changing the color of Dimensions will help users differentiate the data.  The Marks card will allow you to customize how data is displayed. In the example below, to change the color of the Format in the side by side bar chart, drag and drop the Format dimension to the Marks card.  Left-click the Marks property icon next to Format and select the Color property.
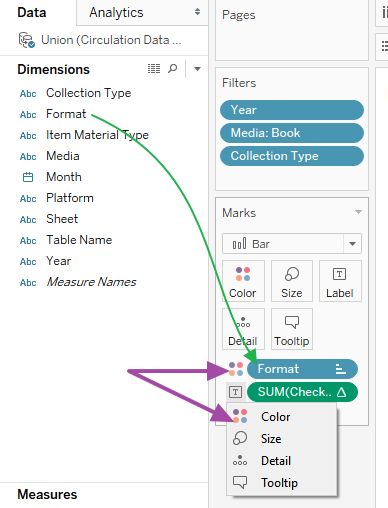
Changing Properties on the Marks Card 

7) Dashboards and stories allow you to bring your data together in a more meaningful, easier to share display. Dashboards allow you to combine data from multiple sheets into a single visualization. Stories allow you to combine data from multiple sheets into a storybook format that users can easily click through.
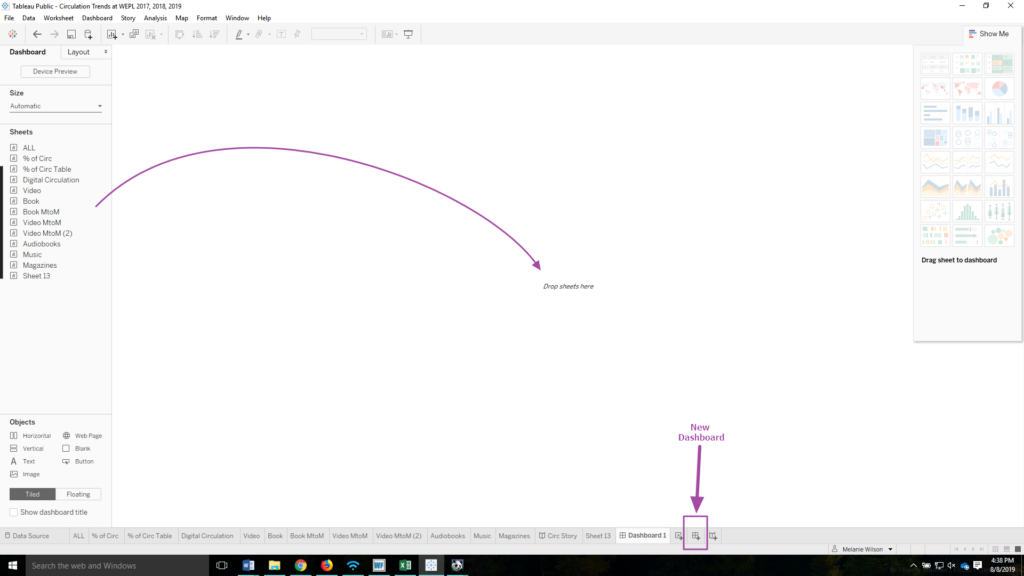
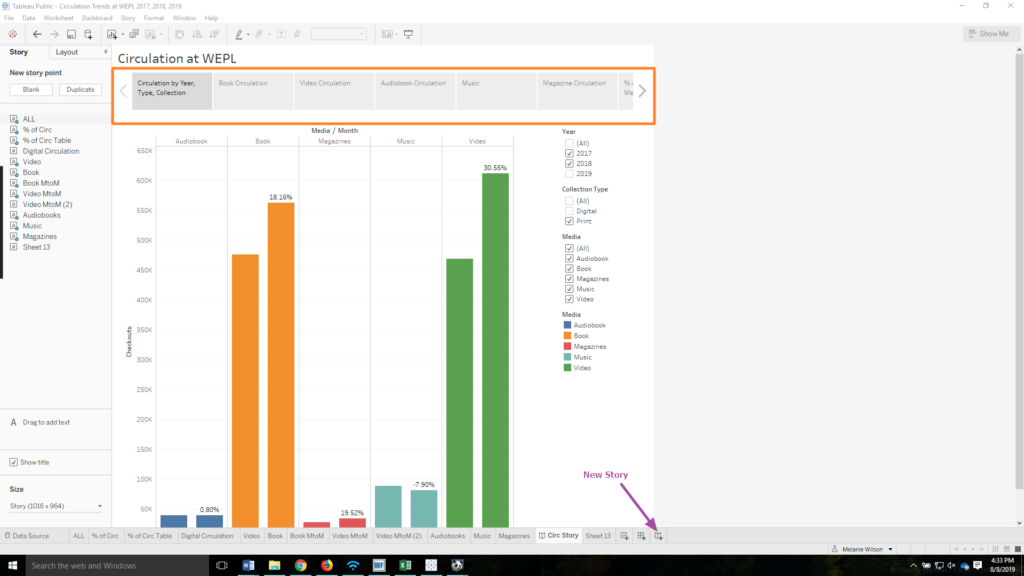
Creating a Dashboard
Creating a Dashboard in Tableau
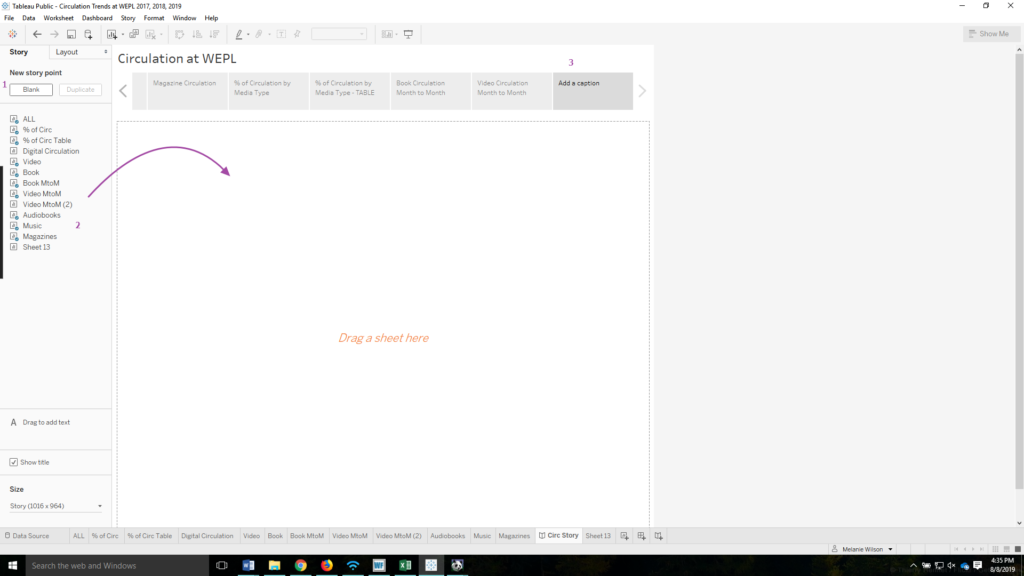
Stories in Tableau
New Story icon and navigation bar in Tableau
Creating a Story
Creating a Story in Tableau

8) When you are comfortable with the Viz that you have created, navigate to File in the menu and click Save to Tableau Public…  . If you would like to share the story or dashboard view, make sure that is open on your screen before you click Save. If you aren’t already signed in, you will be prompted to log in to your Tableau Public account.  As soon as you hit save, your Viz will be published in your Tableau profile for the world to see.  You can make further changes to your document.  Every time you click save the changes are reflected on the Tableau Public website.
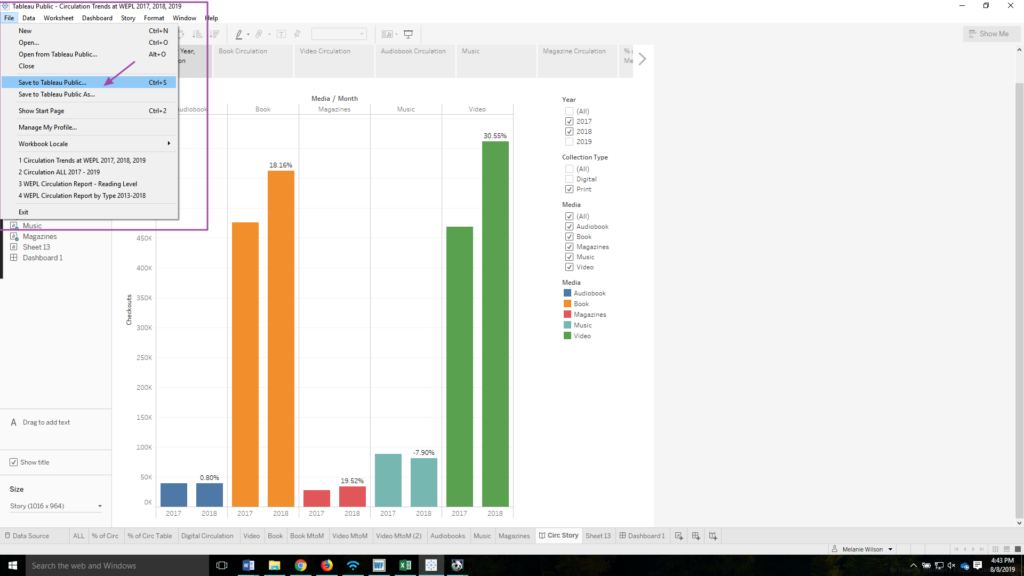
9) Once your Viz is published to the Tableau Public website, it is easy to share the Viz via Link available by clicking on the Share icon.
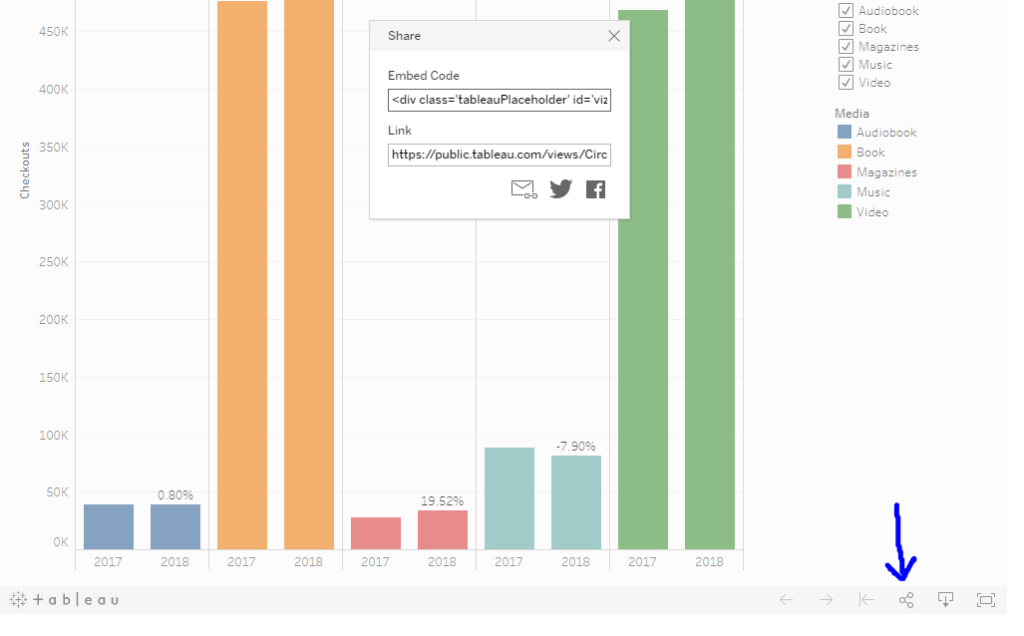
Share Viz in Tableau

Further Resources

Technology & Libraries, Tools of the Trade

Conditional Formatting in Excel

Across all of my professional positions, I have used Microsoft Excel extensively.  Over the years I have learned some tips and tricks and have become an “accidental expert”.  While working at Overdrive, Excel was the primary software that I utilized to normalize data submitted from publishers for upload to the database. At the library, I teach a beginner and intermediate level Excel class.  It is one of the most popular computer classes that the library offers. I’ll demonstrate some of my Excel skills below. 

Using Conditional Formatting in Excel

What is conditional formatting and why would you want to use it? 

The conditional formatting tool is available on the Home tab in Excel.  

Conditional formatting icon

Conditional formatting will highlight cells if they meet certain criteria – this can include identifying duplicate data, locating specific text, and discovering numbers that are above or below a certain range.  It is useful in spotting trends. Once the cells are highlighted, it is then possible to sort or filter the data in the worksheet based on the newly applied formatting.  

I’ll walk us through a very simple application of conditional formatting.

Today I will be using a spreadsheet with a list of magazines from two different suppliers.  I do not want to order the same magazine twice so my main purpose for using conditional formatting in this exercise is to identify and filter out duplicates. 

Click here to download the exercise sample file.

  1. Open the exercise file in Excel.
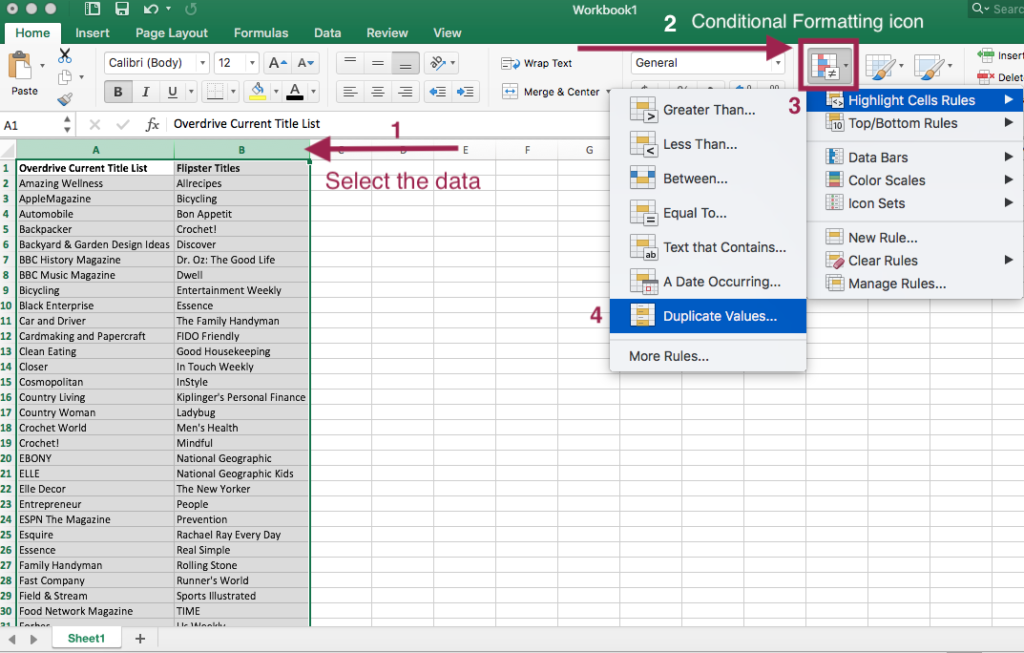
  2. In the exercise file, select the data is columns A & B as this is the data we want to compare. Once the data is selected it will be greyed out with a green border.  From the Home tab, click on the Conditional Formatting icon.Setting Up Conditional Formatting in Excel
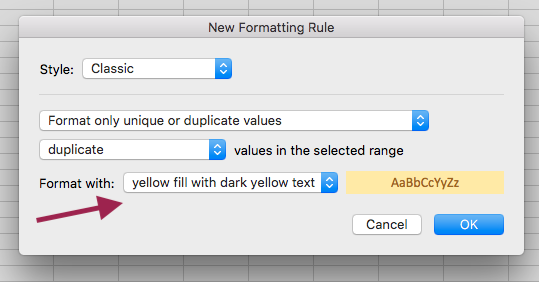
  3. From the conditional formatting menu, select “Highlight Cells Rules”. From the next menu that pops up, select “Duplicate Values…”. A grey box with a number of drop down options will appear.  You can leave all of the drop down options as is. I opted to change the “Format With …” option to “yellow fill with dark yellow text”. Conditional Formatting options
  4. Click the OK button. The duplicate data will now be highlighted in yellow fill as that was the formatting I selected.  If nothing is highlighted, then the condition has not been met and no duplicate data is present.
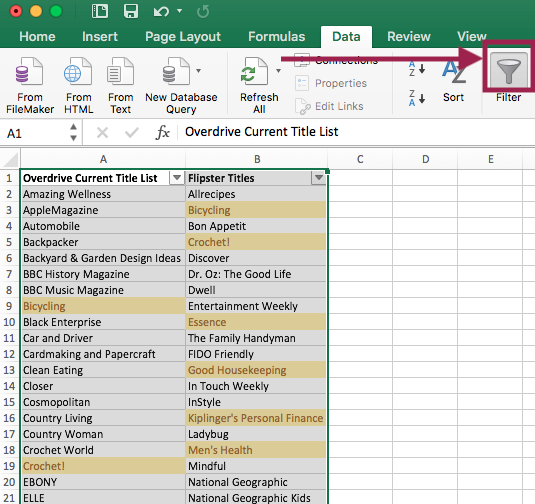
  5. Based on this new formatting, I would now like to filter out the duplicate titles. With the columns still selected and greyed out, select Data from the Menu.  Then click on Filter. Drop down arrows should now appear on your column headers.Filtering in Excel based on cell color
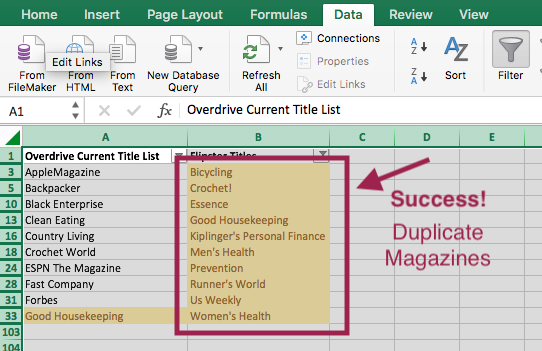
  6. On Column B, select the drop down arrow. In the pop up box, under Filter in the “By color:” field select the “Cell Color.” option. Then click the yellow box. In column B, only the cells highlighted in yellow should now be displaying.  I have now identified the duplicate titles. These are the titles I need to remove from this supplier’s order.Filter by Cell ColorFiltered Data


We can now remove the filter and conditional formatting rules from our worksheet. 

  1. First let’s remove the filter. Click the Filter icon from the ribbon menu.  The filter should now be removed.
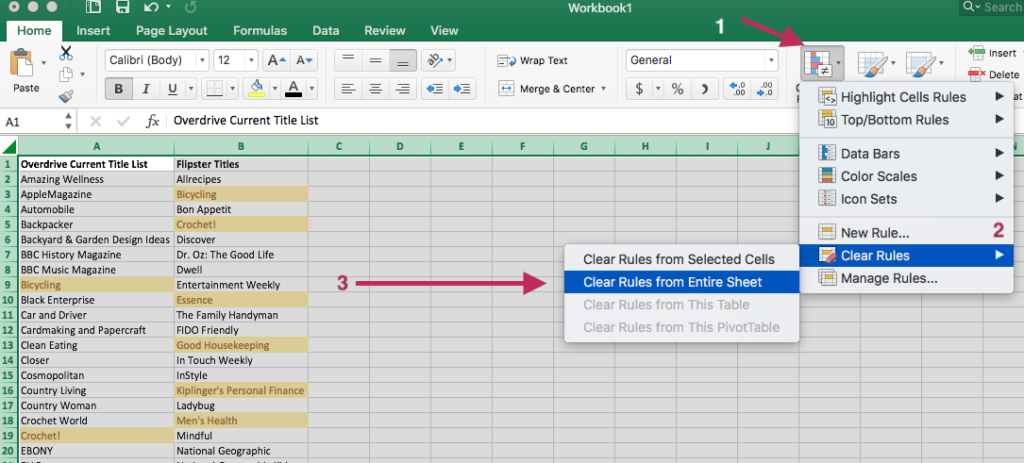
  2. Click the “Home” tab to navigate back to the Home ribbon menu. Then click on the “Conditional Formatting” icon.
  3. Click “Clear Rules”. Then select “Clear Rules from Entire Sheet”.Clear conditional formatting rules
  4. All set!  The worksheet should now be returned to its original formatting. 

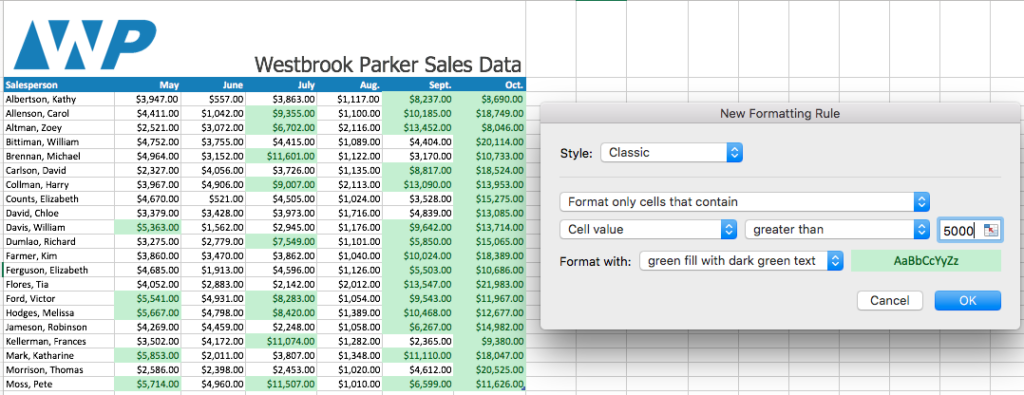
As noted earlier, conditional formatting can also be used to visualize trends.  In the example below, a condition is set to highlight cells in green that have a value greater than 5,000.

Sales trends with conditional formatting

With the cells now being color coded, we can see the September and October were strong sales months.

Digital Literacy, Technology & Libraries

Keeping up with the Web

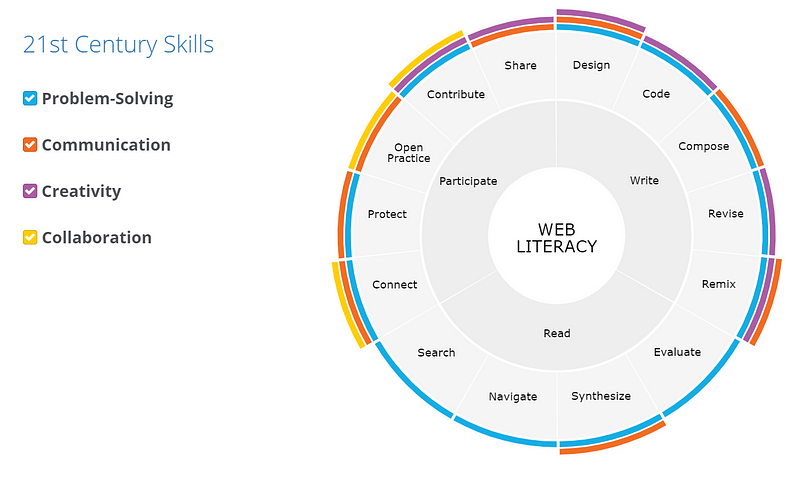
For the last year, the Willoughy-Eastlake Public Library has been participating in the Mozilla Foundation’s Web Literacy pilot funded by an IMLS grant. Mozilla is the free-software company behind the Firefox web browser. The goal of the grant has been to strengthen the web literacy skills of our library staff. The web literacy framework is based on three core 21st century skills: read, write, and participate. These areas are divided into more specific skills such as navigating online, evaluating online sources, coding web pages, and online safety and privacy. This framework is not only essential for library staff to understand but also members of the community. Web literacy is now a life skill. It is the foundation of finding jobs online, getting access to social services, and staying informed.

Library staff at Web Literacy Training
Willoughby-Eastlake Public Library staff participating in web literacy training

During the pilot, the library trained a total of 27 public service staff members that work in three different departments within the 4 library branches: Adult Services, Young Adult, and Children’s. The library has also implemented the web literacy curriculum in the courses that they offer for the public. The library offered a Privacy Matters class at the Eastlake Library in May and at the Council on Aging. Last month, the library offered its first HTML coding class for adults: Building the Web: Intro to Coding. Most recently the Children’s Librarians have begun integrating web literacy activities into the Homeschool Computers and Research classes.

In October, I had the opportunity to attend MozFest in London. The conference explored the current health of the internet and included sessions on online privacy, web literacy for veterans, and working with seniors in digital literacy education.

MozFest
I Believe in the Open Internet space at Mozfest

Web literacy skills are essential for our communities to be able to engage and participate online in safe and productive ways. The library will continue to offer innovative technology classes that strengthen the skills in the community.

Technology & Libraries

Library Website: Creating a Custom Post Type for Databases in WordPress

When I first created a website for the library using WordPress, I added all the databases as regular posts.  I assumed that I would sort them using categories.  This managed to work well enough but has some limitations.  I wanted to have more control over our databases.  I noticed that a number of libraries list their databases on a single page in alphabetical order with the additional option of sorting the databases by topic.  Here are some examples: Shaker Library,  Cuyahoga County Public Library, & Euclid Library.

Originally I assumed I would have to cobble something together by creating a database in MySQL and using PHP to display the results.  I had no idea that this type of functionality was built into WordPress with the ability to create custom post types!

After discovering this very basic feature, I spent sometime thinking about the kind of information that I wanted tied to my database content.  Here is list of what I wanted to include:

  • Name of database
  • Description of database
  • Organization that provides our access to the database
  • Access Restrictions
  • Topic or category of database
  • URL for accessing the database

I decided it would be best to create custom taxonomies for access restrictions, topics, and organization. The URL would be supplied using a custom field (external_url).

Below is list of steps to follow in order to implement a custom post type & taxonomy in your website.  These steps and instructions are only an abbreviated version of what is required.  For a full understanding of how this works, I highly recommend watching the following tutorial: WordPress: Custom Post Types & Taxonomies.

STEP 1: Create a plugin  to register the post type & taxonomy (it is easier than it seems)

Custom Post Type & Taxonomy Code

STEP 2: Edit and create new templates so that the custom post types and taxonomies display properly throughout your website.

If you haven’t already created a child theme for your website, do that now.  All the templates described below will be stored within the child theme folder.  We’ll be creating or editing 7 files total:

  1. single-databases.php
  2. content-databases.php
  3. taxonomy.php
  4. content.php
  5. archive-database.php
  6. functions.php (optional – see step 3)
  7. styles.css (optional)

Brief instructions and code snippets are provided here.

STEP 3: Linking to an External URL

If you are interested in having your database post name link directly to an external URL, follow the steps in this article: How to Link to External Links from the Post Title in WordPress

STEP 4: Sorting the databases in alphabetical order

If you would like your new custom post type to display in alphabetical order, add this code to the function.php page:

function owd_post_order( $query ) {
if ( $query->is_post_type_archive(‘databases’) && $query->is_main_query() ) {
$query->set( ‘orderby’, ‘title’ );
$query->set( ‘order’, ‘ASC’ );
}
}
add_action( ‘pre_get_posts’, ‘owd_post_order’ );

“The more you know the more you realize you don’t know” is what truly intimidates me about web development but also inspires me to dive into the rabbit hole and learn more (so much more!).

Below are the steps and resources that I followed and used to implement custom post types.


Resources:

WordPress: Custom Post Types & Taxonomies (Lynda.com – Paid resource)

How to Link to External Links from the Post Title in WordPress (WPBeginner.com)

Creating an Alphabetical Glossary of Posts in WordPress (Kathy is Awesome)

Listing Custom Taxonomy Terms

Order Custom Post Types Alphabetically (One Website Design)


Technology & Libraries

Return on Investment: OLC

Finding from Return on Investment of Ohio’s Public Libraries &Comparison with Other States, Howard Fleeter & Associates (April 2016):

  • Ohio has the second highest percentage of registered borrowers at
    77.7%, behind only Minnesota.
  • Ohio has the highest number of library transactions per capita in the
    country, utilizing library materials and services at a rate that is more than
    twice the national average.
  • Ohio also ranks first nationally in library visits per capita, averaging 7.5
    visits per year for each person.
  • While Ohio public libraries provide an extensive array of services to
    patrons, they also do so in a cost effective manner. Ohio has one of the
    lowest costs per library transaction, ranking 41st nationally and well below
    the national average cost.
  • Ohio’s public libraries provided nearly $2.7 billion in direct economic value
    (or “benefit”) to Ohio residents in 2014.
  • When the economic benefit above is compared with statewide total
    operating expenditures of $687.5 million, the ROI from Ohio’s public
    libraries in 2014 was 3.89. This means that for every $1 spent by public
    libraries in Ohio, $3.89 in benefit was delivered to Ohio residents.
  • When economic multiplier effects are included, each $1 spent by Ohio
    public libraries returns a total economic value of $5.48 to Ohioans.
  • Technology & Libraries

    Libraries and Learning

    On April 7, 2016, the Pew Research Center released a new study on Libraries & Learning.

    Most Americans believe libraries do a decent job of serving the education and learning needs of their communities and their own families. A new survey by Pew Research Center shows that 76% of adults say libraries serve the learning and educational needs of their communities either “very well” (37%) or “pretty well” (39%). Further, 71% say libraries serve their own personal needs and the needs of their families “very well” or “pretty well.”

    Overall, in the past 12 months, 50% of adults interacted with a library through its facility, website or app.

    The most affirming aspect of the study is that library users are major technology adopters.

    Library users are more likely to be digital technology users. The survey found that people who used a library or bookmobile in the past year are more likely than non-library users or less-recent users to be technology users.

    • Internet – 93% of those who used a library or bookmobile in the past 12 months are internet users.
    • Smartphones – 76% of those who used a library or bookmobile in the past 12 months are smartphone users.
    • Home broadband – 74% of those who used a library or bookmobile in the past 12 months are home broadband users.
    • Social media – 74% of those who used a library or bookmobile in the past 12 months are social media users.

    This counters the argument that the internet and technology are replacing the need for the library in people’s lives. In fact, it proves the opposite. The library and technology can co-exist and complement each other nicely.

    Digital Literacy, Technology & Libraries

    Bringing Trust to the Table

    Trust is fundamental to so much of what libraries do. I think it is one of the main reasons that people like libraries. Fostering a trusting environment should be considered in all library decisions from building remodels to lending new materials. Ultimately, librarians and administrators need to look at themselves as part of the community that they are serving instead of being separate from it. Essentially librarianship is about building relationships and opening a dialogues.

    I think this is true for how we engage and interact with coworkers. Personally, I know that I need to bring more trust to the table or maybe I need to realize that my coworkers do indeed trust me!

    I was listening to an episode of Freakonmics Radio about hitchhiking. I have hitchhiked in Scotland and Ireland. All of my experiences hitchhiking were very positive. I would not have been able to get to the outskirts of Skye or the coast of Torridon if it wasn’t for hitching a ride. It also allowed me to interact with locals. I couldn’t imagine hitchhiking in America mainly because our infrastructure and highway system does not lend itself to hitching.

    Anyway, hitchhiking requires a great deal of trust. Statistician, Bill James, feels that hitchhiking should be reinvigorated:

    Yes, I do. And the reason I do is that we have a better society when we can trust one another. And wherever and whenever there’s an evaporation of systems based on trust I think there’s a loss to society. I also think that one evaporation of trust in society tends to feed another, and that we would have a better society if we could, rather than promoting fear and working to reduce the places where terrible things happen, if we could promote trust and work on building societies in which people are more trustworthy. I think we’re all better off in a million different ways if and when we can do that.”

    Technology & Libraries

    Net Neutrality Update

    On Feb. 26, 2015, the FCC approved strong open Internet rules under Title II of the Communications Act.

    Learn more here: Save the Internet

    The FCC recently passed the Open Internet Order, which became active on June 12, 2015.

    The Order also commands that ISPs cannot “unreasonably interfere with or unreasonably disadvantage” the ability of consumers to select the online content and services they want and the ability of content providers to reach those consumers. The FCC cites library and public education comments proposing an “internet reasonable” standard that would protect the unique and open character of the Internet.

    Of great importance to the coalition was ensuring libraries and educational institutions are explicitly included in network neutrality protections and to differentiate between public broadband internet access and private networks. The FCC specifically affirmed both points.

    Source: Open Internet Order Now Effective, by Carrie O’Maley Voliva on June 16, 2015
    http://publiclibrariesonline.org/2015/06/open-internet-order-now-effective/

    Technology & Libraries, Tools of the Trade

    Canva is my Friend

    My work at the library involves creating a lot of promotional materials for upcoming events. These marketing materials tend to be for display on our website, Facebook, & promotional TVs within our libraries. When I first started at the library I wrestled with Photoshop to make these graphics. Using Photoshop was time-consuming for the goal I was trying to accomplish. Photoshop is a great product but isn’t always the best choice.

    I learned about Canva.com at an Emerging Tech workshop at NEO. I have used it ever since. Creating graphics in Canva is now part of my daily workflow. It is easy to create professional looking graphics in Canva. It is especially easy to include these images on social media sites & in email marketing.

    Benefits of Canva:

    • Free!
    • Web based
    • Pre-made layouts & text
    • Great font options
    • Free graphics & icons
    • Downloadable files

    Cons: There is no easy way to copy and paste between different files. Formatting is lost when copying text to a new file.

    Canva.com is a great addition to any library’s marketing toolbox. It is also useful for small businesses looking for free marketing tools.


    Digital Literacy, Technology & Libraries

    Coding for the Masses – Striving to Improve Digital Literacy

    Our concept of information literacy is evolving more and more rapidly as technology becomes ingrained in our everyday lives.  Schools and educators are realizing the importance of expanding an interest in computer science and coding to a wider audience and at an earlier age.  On January 24, 2014, the popular science podcast, ScienceFriday, ran an episode entitled “Is Coding the Language of the Digital Age?“.  The panel discussed ways that coding can be incorporated into our existing education system in order to close the gap for women and minorities.

    The ability to code is becoming increasingly important in order to succeed professionally and to be able to creatively solve problems that affect all communities.  The logic and problem solving skills are becoming as relevant as the traditional sciences taught in the classroom.  A number of accessible resources were discussed:

    Hour of Code

    The Hour of Code campaign aims to demystify computer science for students across the country by taking them through introductory tutorials that can be completed online, on a smartphone, or even unplugged.

     Girl Develop It

    Empowering women of diverse backgrounds from around the world to learn how to develop software.

    Alongside these resources, libraries can use the Web Literacy Standard, developed by Mozilla, to create workshops to offer to the public to allow users of all ages to gain insight into the empowering world of coding.  For the self-learner, free online tutorials are offered through organizations such as Codecademy.

    Libraries are already offering the public ways to improve their digital literacy.  The St. Paul Public Library developed the Northstar Digital Literacy Certificate.  This project “defines basic skills needed to perform tasks on computers and online.”

    As more and more job applications and tests, such as the GED, move to a digital-only format,  information skills become vital.